Aug 12, 2026
How to Analyze Volleyball Setter Stats
How to Analyze Volleyball Setter Stats
Every hitter's number in a box score is really a setter's number too. A kill doesn't happen without a set, and a bad set can turn a good swing into an error before the hitter ever touches the ball. This is the third post in our ongoing breakdown of the same match — this time from the setter's chair.
We touched on serve/pass trust in Step 4 of the original breakdown. This post goes one level deeper: who's actually setting, how the offense is distributed, and what separates a clean set from a scrambled one.
Who's actually running the offense
This team ran a two-setter system. Lily A. took the most volume — 25 set attempts — while Maya B. ran 21. But volume isn't the same as impact:
Lily A.: 25 set attempts, 8 assists (sets that directly led to a kill) — a 32% assist rate
Maya B.: 21 set attempts, 11 assists — a 52% assist rate
Maya B. is setting less often, but a noticeably higher share of her sets are converting directly into kills. That's not automatically a case for benching Lily A. — assist rate is shaped by which hitters are on the front row in a given rotation as much as by the setter's own decision-making — but it's a real enough gap to actually look into, not just note in passing.
See the full page of stats here.
Set distribution: who's getting the ball, and how efficiently
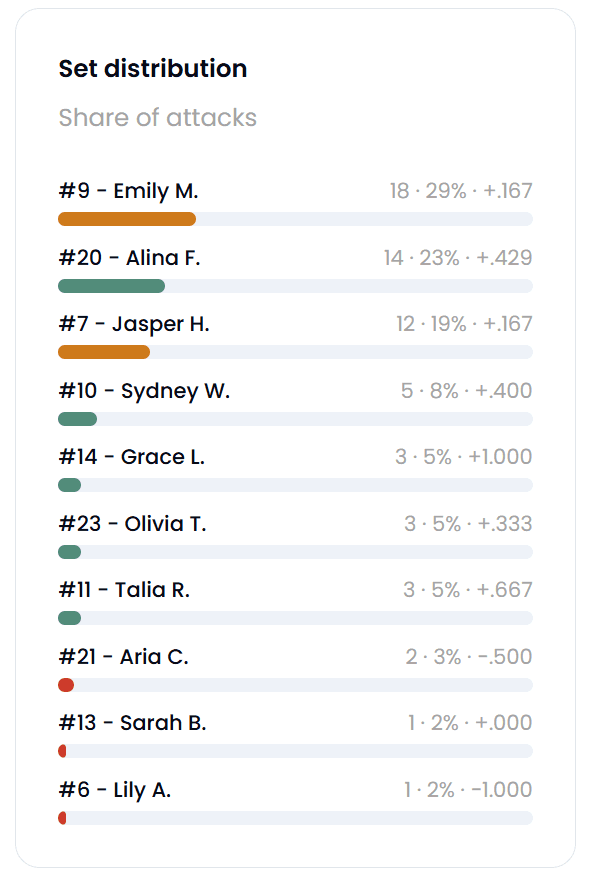
Emily M. is getting the highest share of sets (29%) but converting at only +.167. Alina F. is getting less volume (23%) but hitting +.429 — nearly three times more efficient on fewer touches.
This is the same volume-vs-efficiency gap we flagged in the original post's Step 3, but seeing it through the set-distribution lens adds something: this isn't just "Alina F. is the better hitter," it's "the offense is choosing to feed Emily M. more often despite Alina F. converting better." That's a setter-and-coaching decision, not just a hitter performance question — worth a conversation between the setters and the hitting coach about why the distribution is shaped this way.
In-system vs. out-of-system: how much does a clean pass actually matter?

In-system hit percentage: +.288 on 59 attempts. Out-of-system: +.000 on just 3 attempts. Transition kill rate (after a dig): 41.2%."
The out-of-system sample here is tiny — only 3 attempts — so treat that specific number as a signal, not a verdict. But directionally, it confirms what most coaches already suspect and rarely quantify: a clean first pass is doing most of the work for this offense. Only 3 out of 62 total attacks came out of system all match, which itself says something — either the team's serve-receive is genuinely strong (consistent with the low aces-allowed number from the defensive breakdown), or broken plays are being converted straight to a free ball / dump rather than a real out-of-system swing.
The pass-to-kill funnel
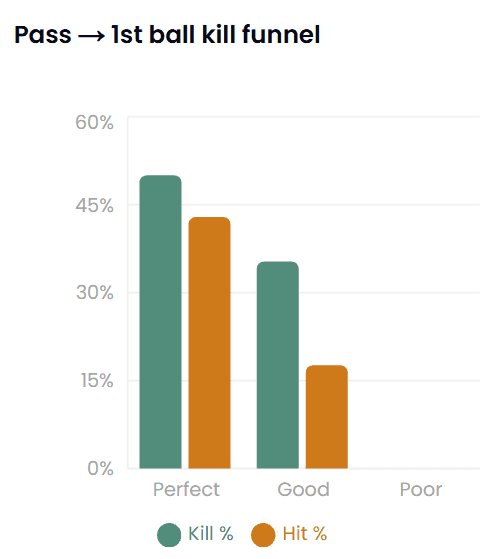
[[INSERT IMAGE: 14_pass_kill_funnel.png — caption: "A 'Perfect' pass converts to a kill roughly 50% of the time. A 'Good' pass drops to around 35% kill rate and a noticeably lower hit%. No attempts came off a 'Poor' pass at all."]]
This is the clearest visual argument for why pass rating matters as much as it does: the gap between "Perfect" and "Good" isn't marginal, it's close to a 15-point swing in kill rate. Every pass that lands as "Good" instead of "Perfect" is a real, measurable dent in the offense's ceiling — not just a technicality on a stat sheet.
One actionable change for next practice
Two specific, checkable things came out of this read:
Review why Emily M. is getting more sets than Alina F. despite converting at roughly a third the efficiency. This might be a legitimate tactical choice (matchup-based, rotational), but it's worth confirming it's a decision and not just a habit.
Compare Lily A.'s and Maya B.'s rotations directly. If the assist-rate gap holds up once you control for which hitters were on the floor for each setter, that's worth a real look at shot selection and tempo between the two.
Curious how your own setters' distribution and assist rates break down?
Try it on your own team
Set distribution, assist rate, in-system vs. out-of-system splits — all of it is generated automatically from tagged match footage on Tavo, no manual charting required.
Not ready to dive in? Learn more about the platform here.
This is the third post in our ongoing breakdown series, following the original 5-Step Read and the defensive breakdown.