Aug 12, 2026
How to Analyze Volleyball Stats: What a 50–39 Win Actually Tells You
How to Analyze Volleyball Stats: What a 50–39 Win Actually Tells You
If you're trying to figure out how to analyze volleyball stats beyond just the final score, start here: your team just won 50–39. Nice scoreline. But here's the question most coaches never ask: did you win, or did they lose?
Of the 50 points scored in this match, 36 were earned outright — kills, aces, blocks. The other 14 came from opponent errors. Flip it around: of the 39 points given up, only 20 were the other team beating you. The remaining 19 were unforced errors your own team handed over.
That single stat — earned vs. gifted — is step one of a simple framework for reading any match's data. Below, we walk through a real match tracked on Tavo, rotation by rotation, player by player, so you can apply the same read to your own team.
We call it the 5-Step Read.
Step 1: Start with the story, not the stats
Before diving into individual players or rotations, look at how your points were actually won and lost. It reframes the score line from "we won" into "here's specifically why."
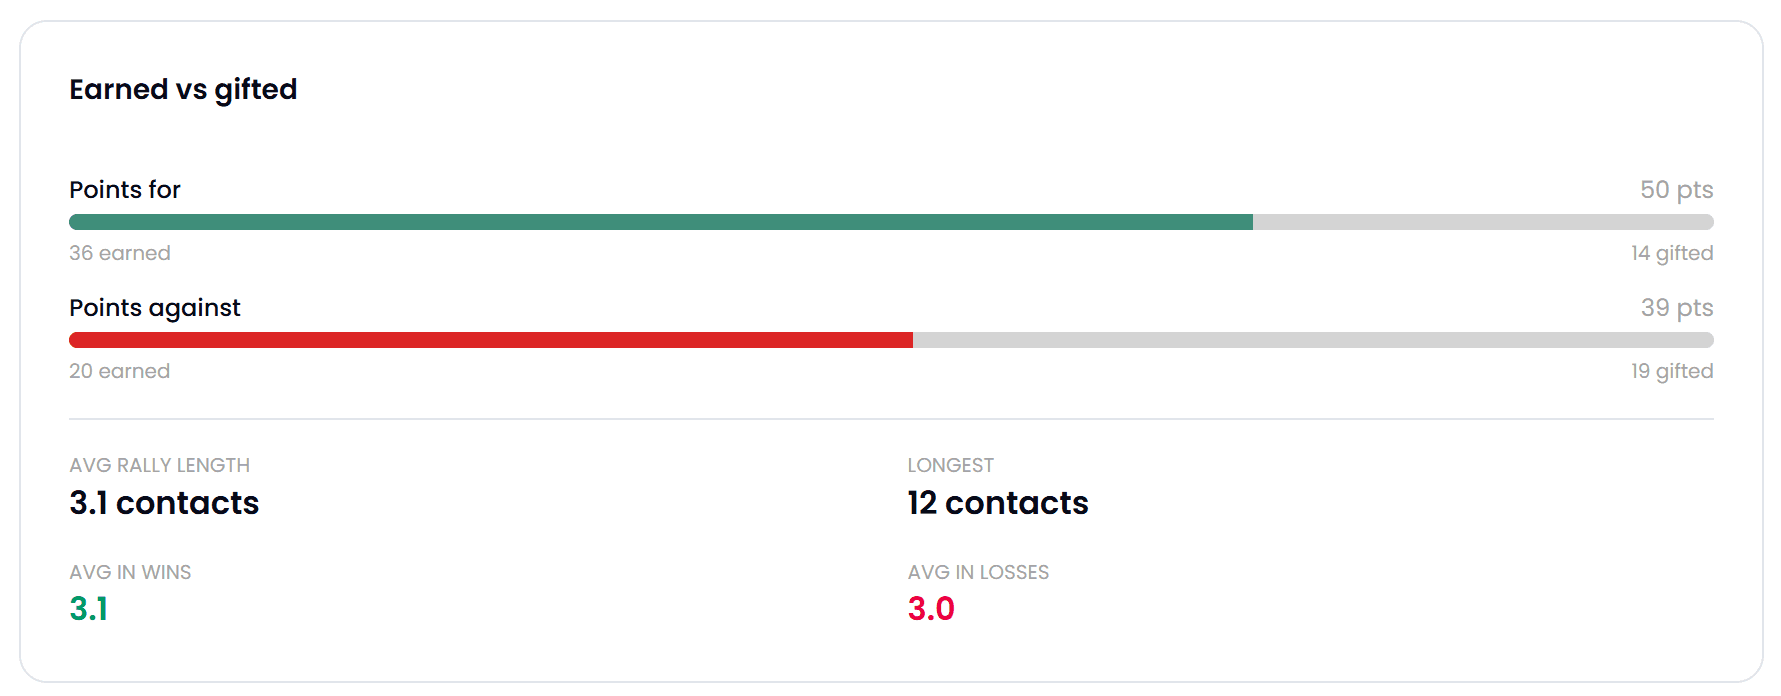
Points for: 36 earned, 14 gifted. Points against: 20 earned, 19 gifted. Translation: this team's offense is doing real work, but nearly half of the points they gave up were self-inflicted — a fixable problem, not a talent gap.
See the full page of stats here.
If your gifted-points-against number is high, that's not a scouting issue — it's a discipline and execution issue, and usually the single fastest thing to clean up in practice.
Step 2: Find your weak rotation
Not all six rotations are created equal. Most teams have one or two spots on the floor where things fall apart — and most coaches don't know exactly which ones without looking.
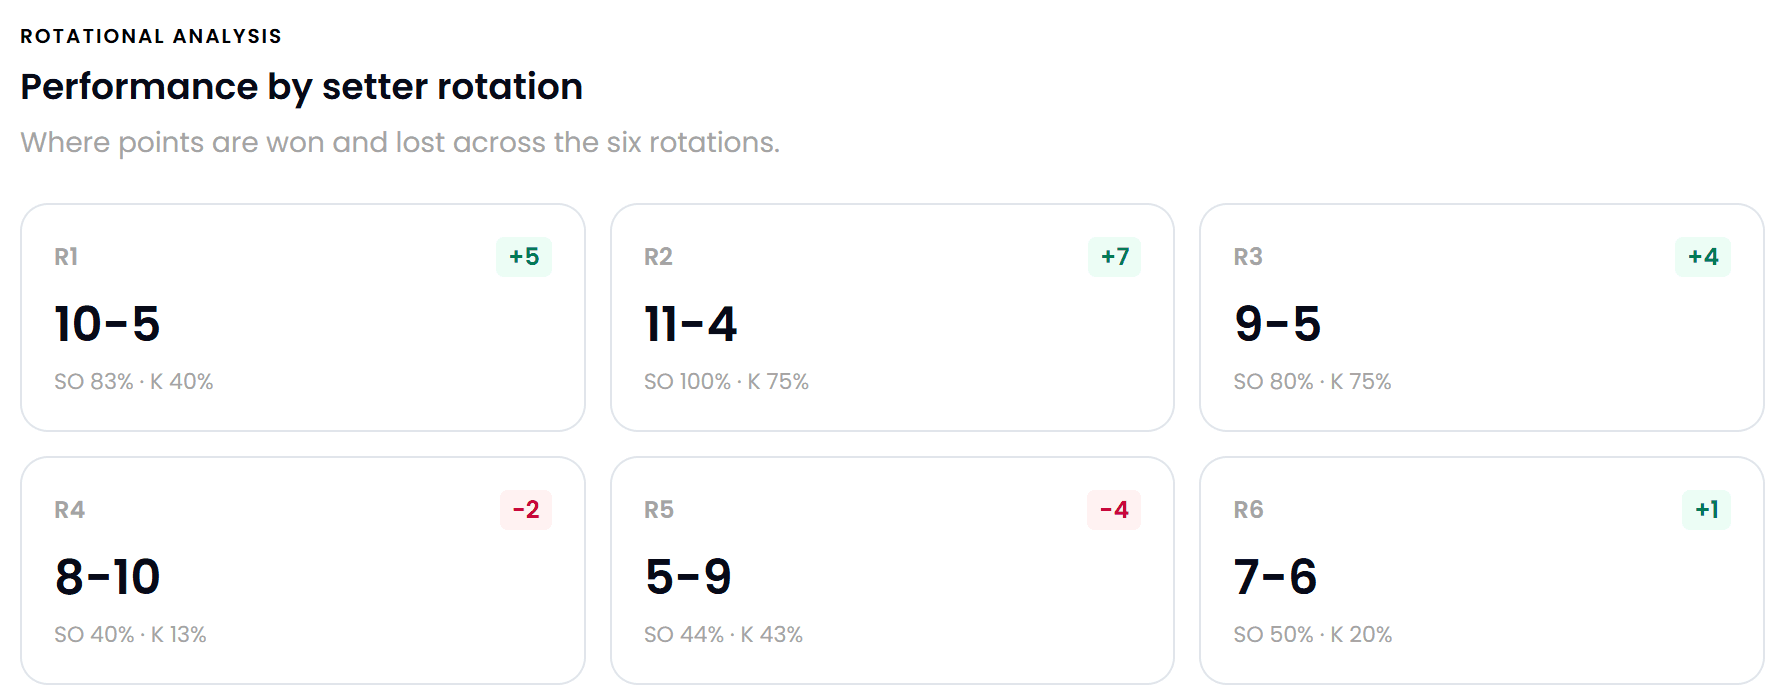
Six rotations, six very different outcomes. R2 is a stronghold (+7, 100% sideout%). R5 is a clear liability (-4, only 44% sideout%).
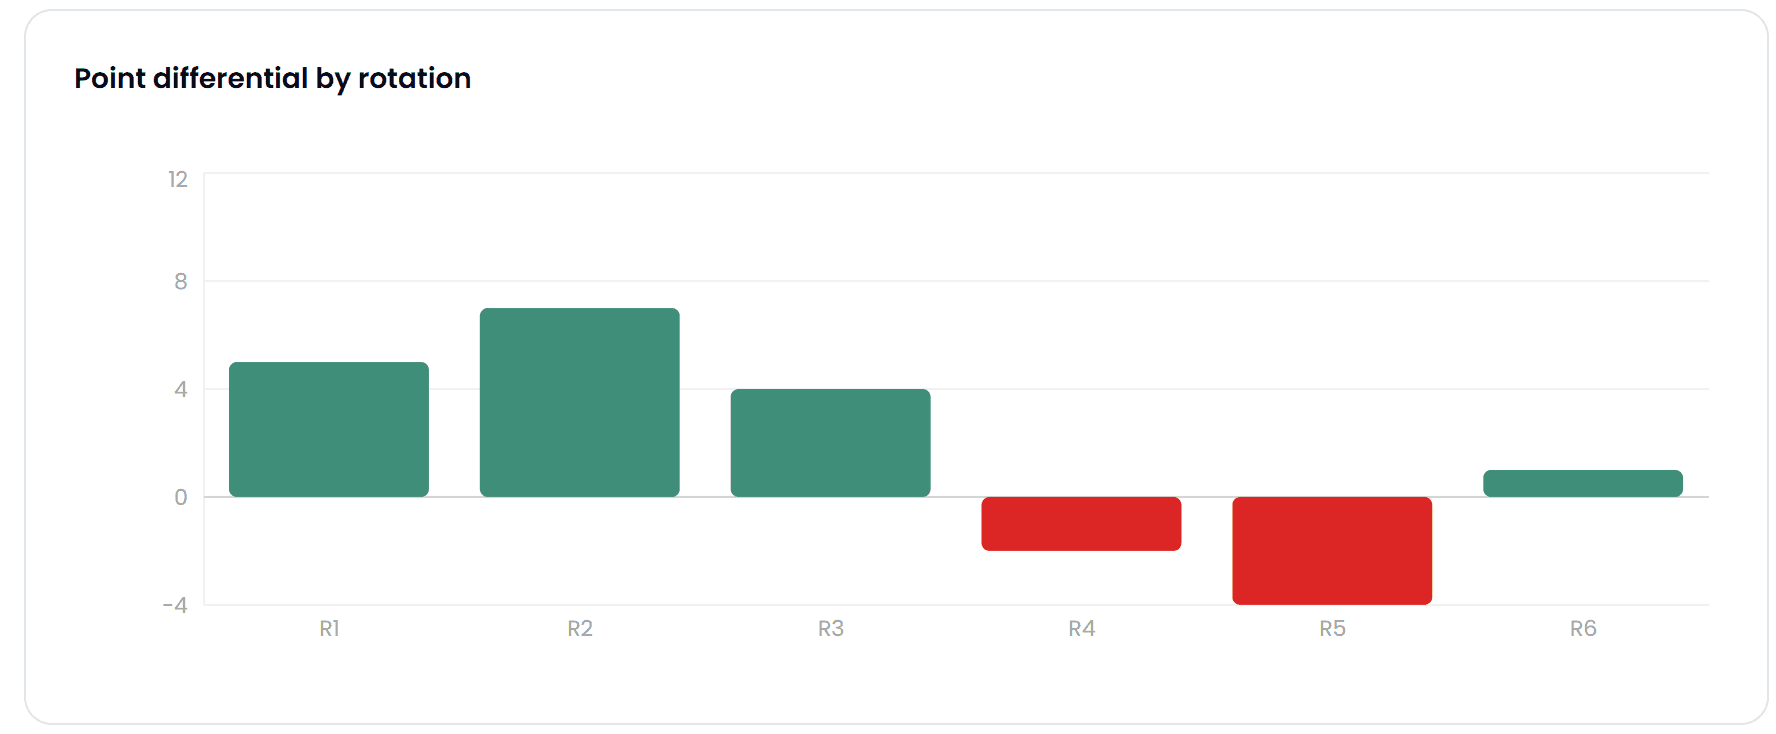
Visualized, the pattern is obvious: this team is winning comfortably in R1–R3, and actively bleeding points in R4 and R5.
This is the kind of insight that's nearly impossible to catch from a paper stat sheet in real time, but jumps out immediately once it's visualized — and it tells you exactly where to spend your next practice.
Step 3: Volume vs. efficiency — who's actually your best hitter?
It's easy to assume your highest-volume hitter is your best hitter. Often, they're not the same player.
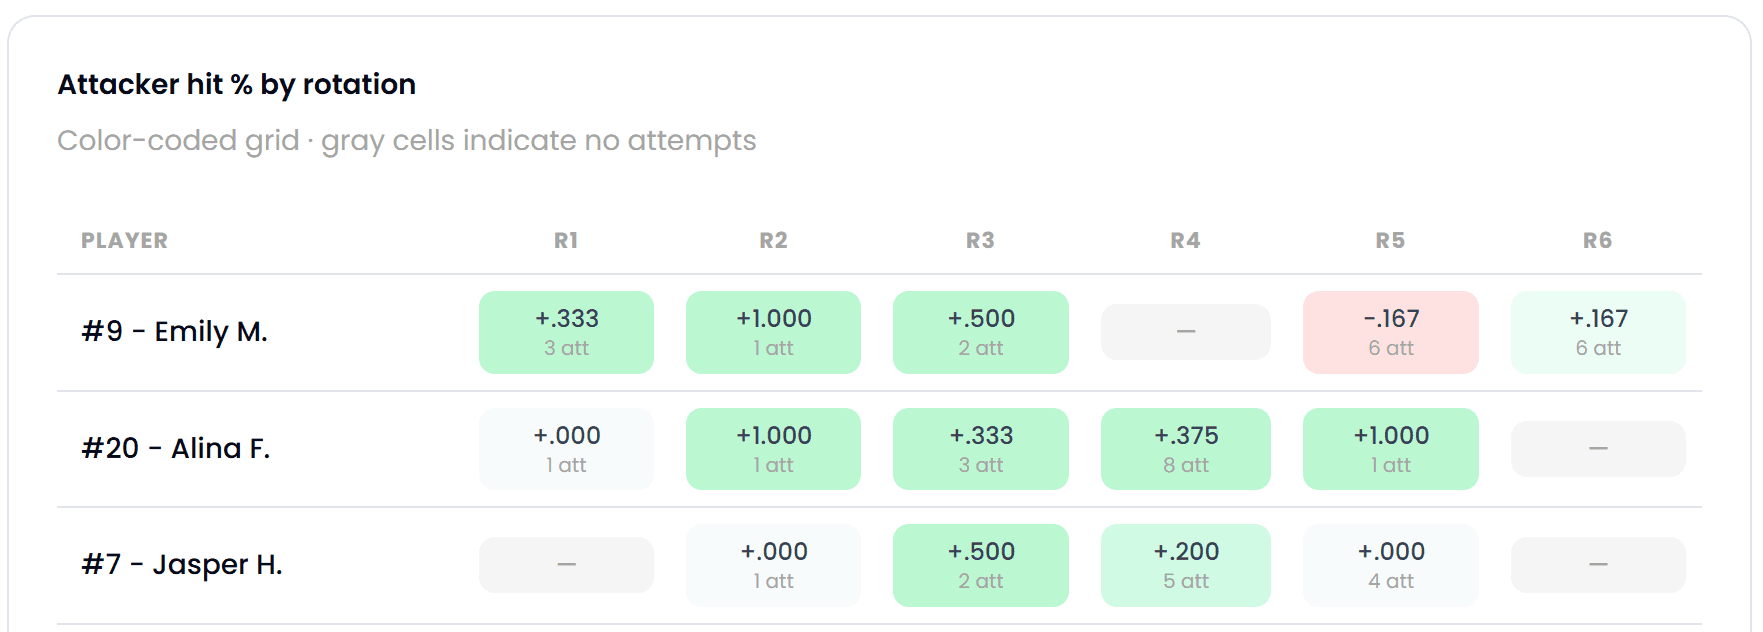
Notice Rotation 5: two hitters — including the team's highest-volume attacker — go cold here. That's not a coincidence; it's exactly the same rotation flagged as a liability in Step 2. The data is telling a consistent story.
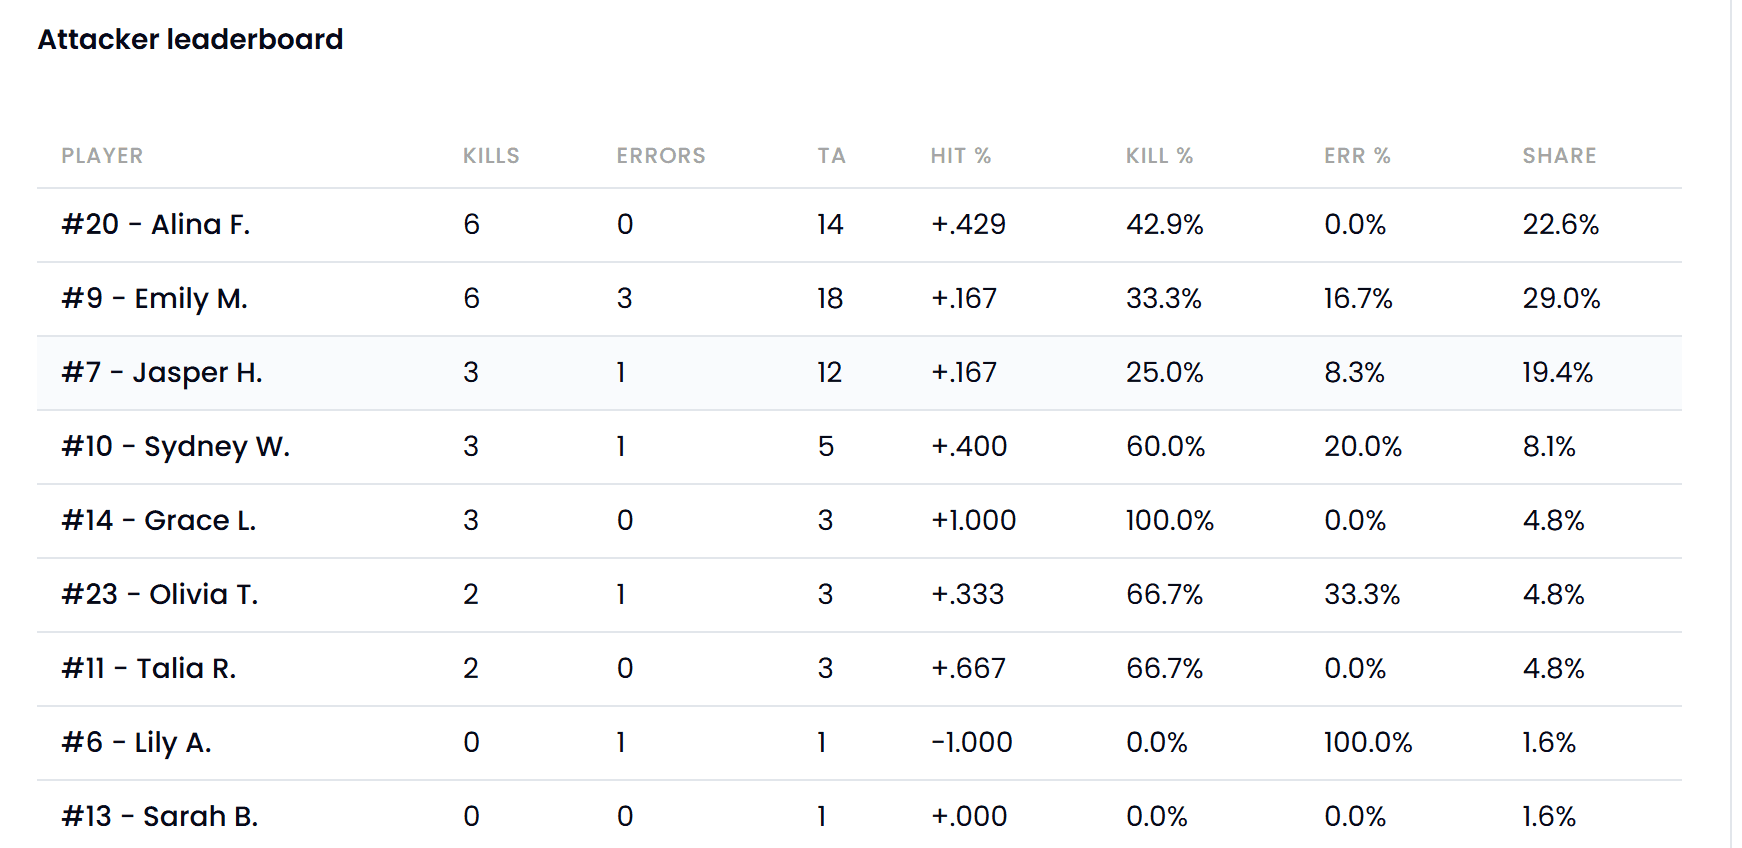
The full picture: the team's highest-volume hitter (18 attempts) is hitting +.167. A lower-volume hitter (14 attempts) is hitting +.429 with zero errors. That's a real signal to redistribute sets — not a knock on the high-volume hitter, just an opportunity sitting in the data.
Step 4: Serve and pass matchups
Offense gets the attention, but who you trust on serve-receive — and who you send to serve under pressure — often decides close sets.
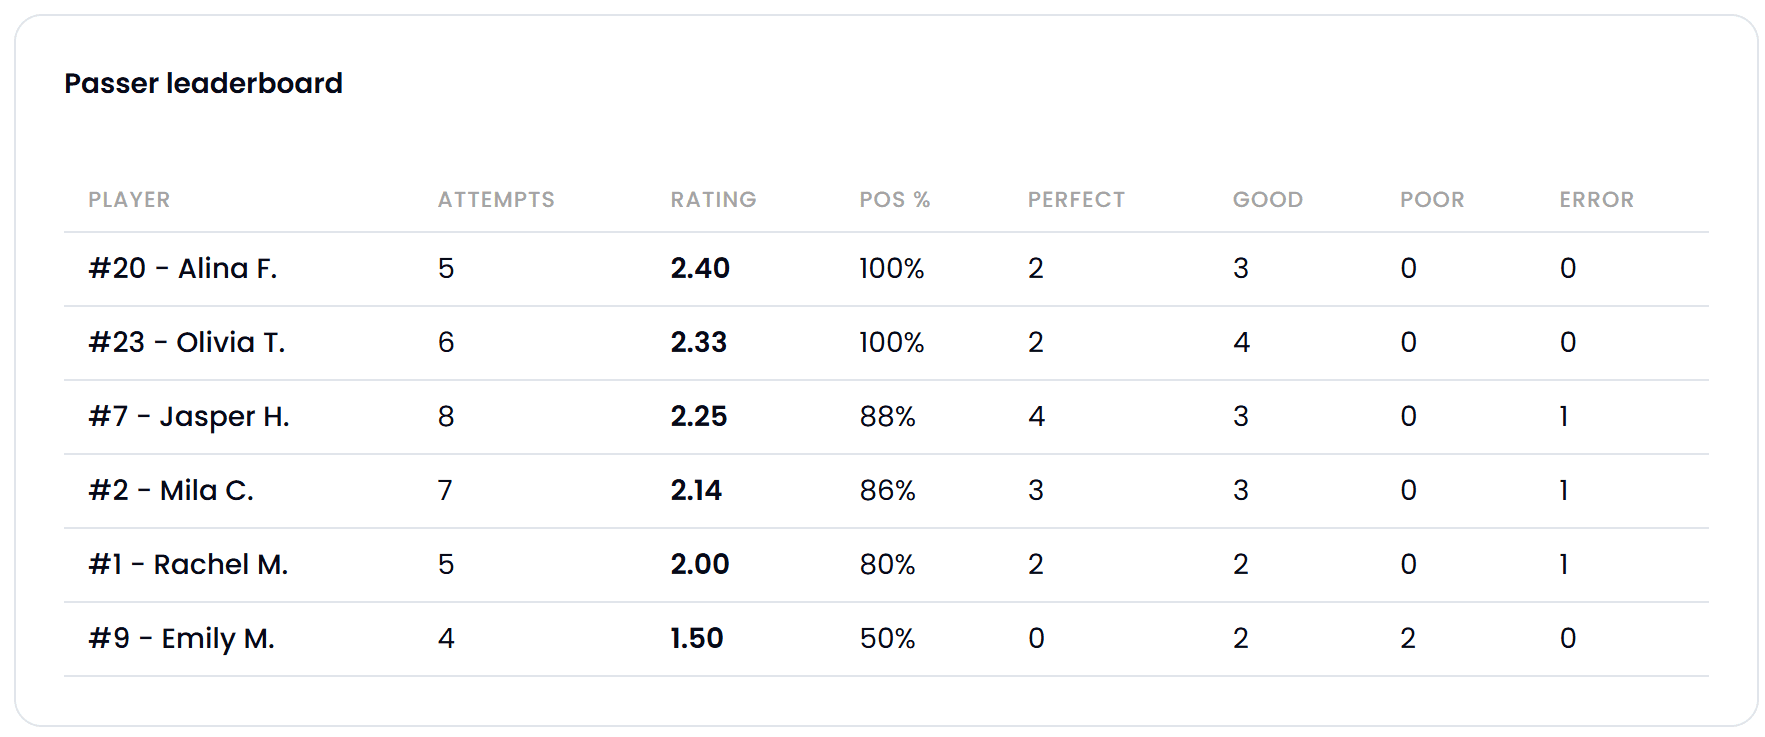
Two passers are running 100% positive pass rate. That's exactly who you want absorbing serve-receive load in a tight rotation.
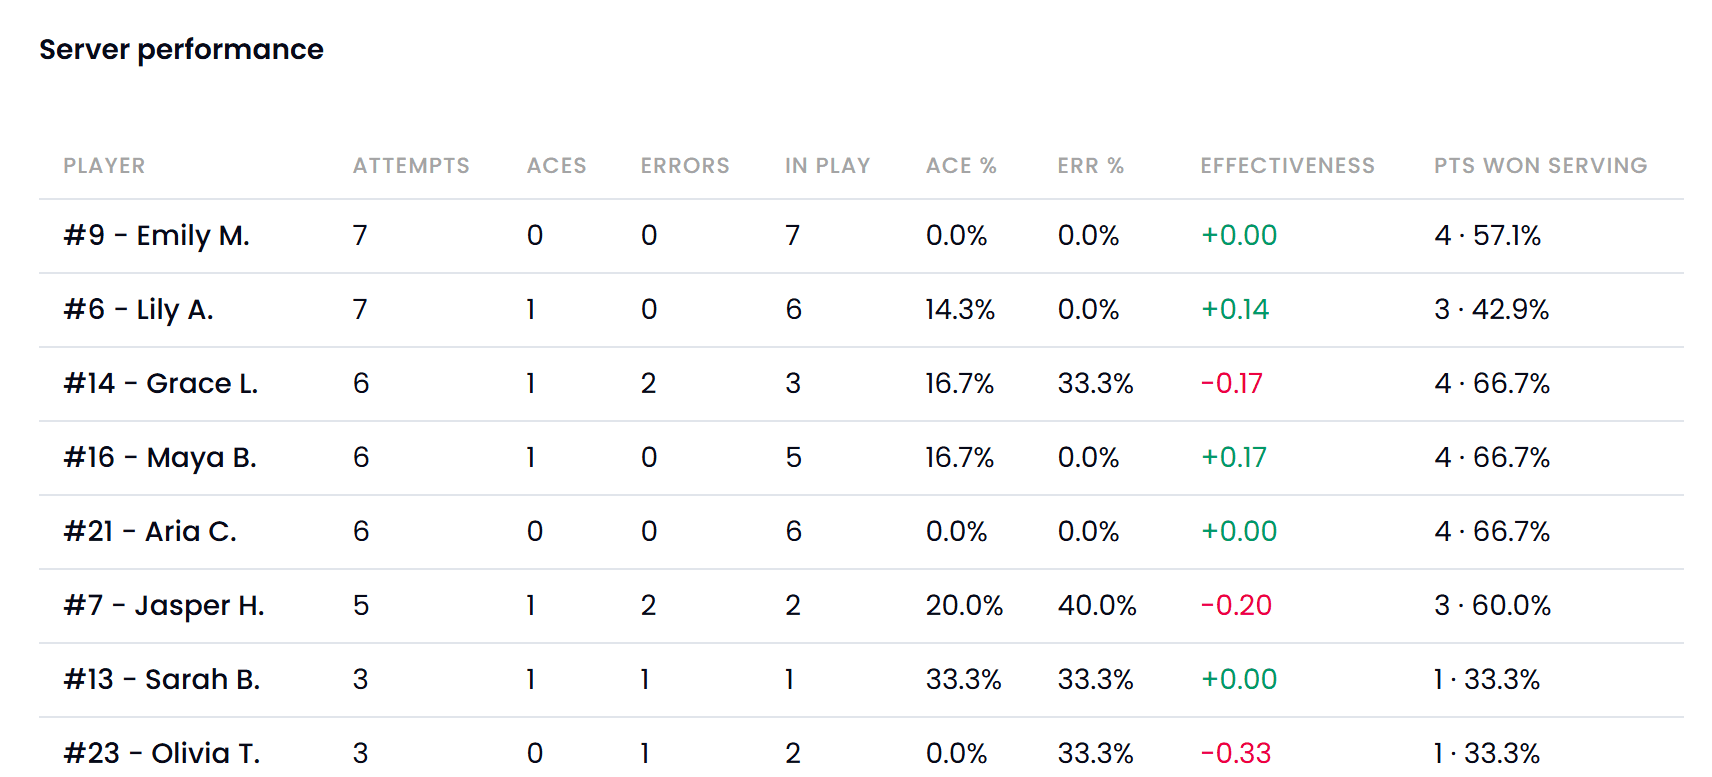
On the serving side, effectiveness and error rate tell a different story than aces alone — a player with zero aces but zero errors and a high point-win rate may be more valuable than a high-risk, high-error server.
Step 5: One actionable change for next practice
All of this is only useful if it turns into a decision. From this single match, three things stand out clearly enough to act on immediately:
Target Rotation 5 in the next serve-receive drill — it's the clearest, most consistent weak point across multiple stats.
Redistribute a portion of sets from the highest-volume hitter to the most efficient one — a small shift here compounds over a season.
Cut down unforced errors. 19 of the 39 points given up in this match were self-inflicted — 9 serve errors, 8 attack errors, 2 reception errors. That's the same "gifted" pattern flagged all the way back in Step 1, now broken down by exactly where it happened — which makes it a specific, drillable target instead of a vague "play cleaner" note.
That's the whole framework: story → weak rotation → volume vs. efficiency → serve/pass trust → one concrete change. Five steps, applied to any match, turn a stat sheet into a practice plan.
Curious what your own team's rotation breakdown looks like? Check out pricing for our Individual & Team Plans
Every stat in this breakdown — earned vs. gifted, rotation efficiency, hitter volume vs. hit%, pass ratings — is generated automatically from tagged match footage on Tavo. No manual charting, no spreadsheets.
We'll be publishing more breakdowns like this — including position-specific reads (libero, setter) and a basketball version once that launches.